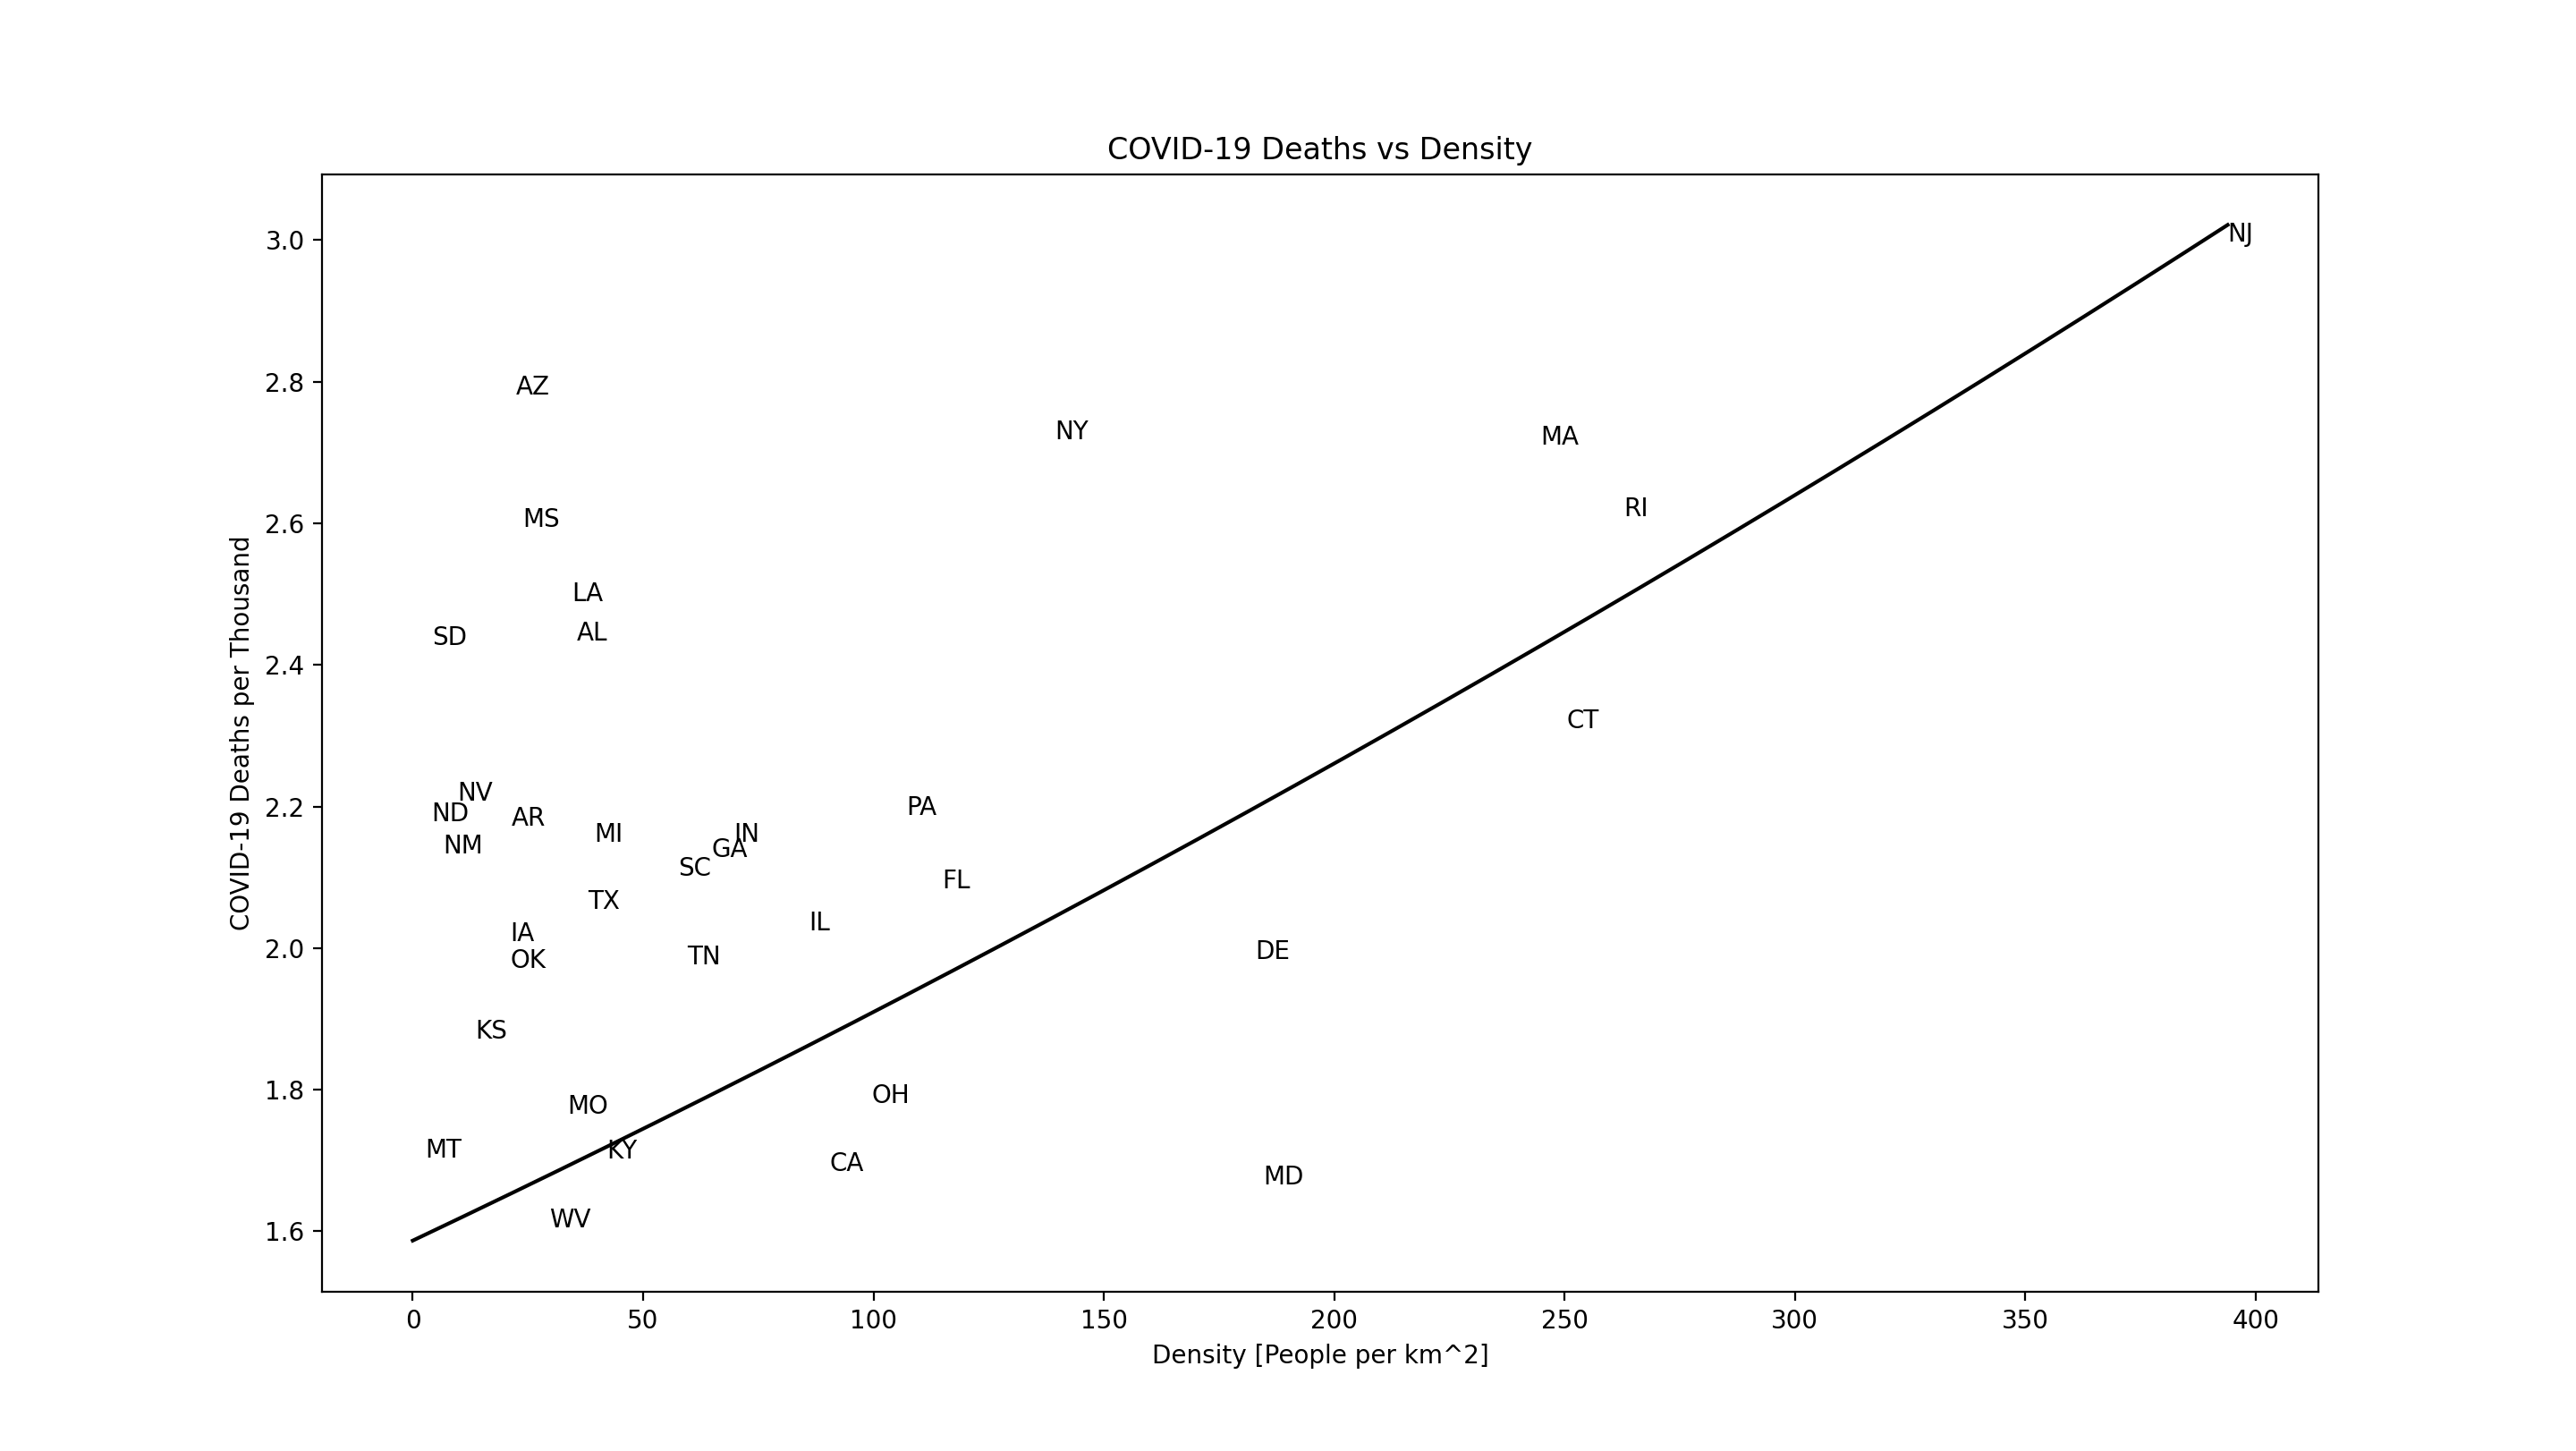
It stands to reason that the spread of any transmissible disease will be impacted by population density. In the US, this is probably part of the reason that the worst-hit states are those with the highest population densities (NY, NJ, RI, etc). The figure below shows a fairly linear relationship between population density and COVID-19 deaths. The relationship is most pronounced above a density of ~100 people per square km.
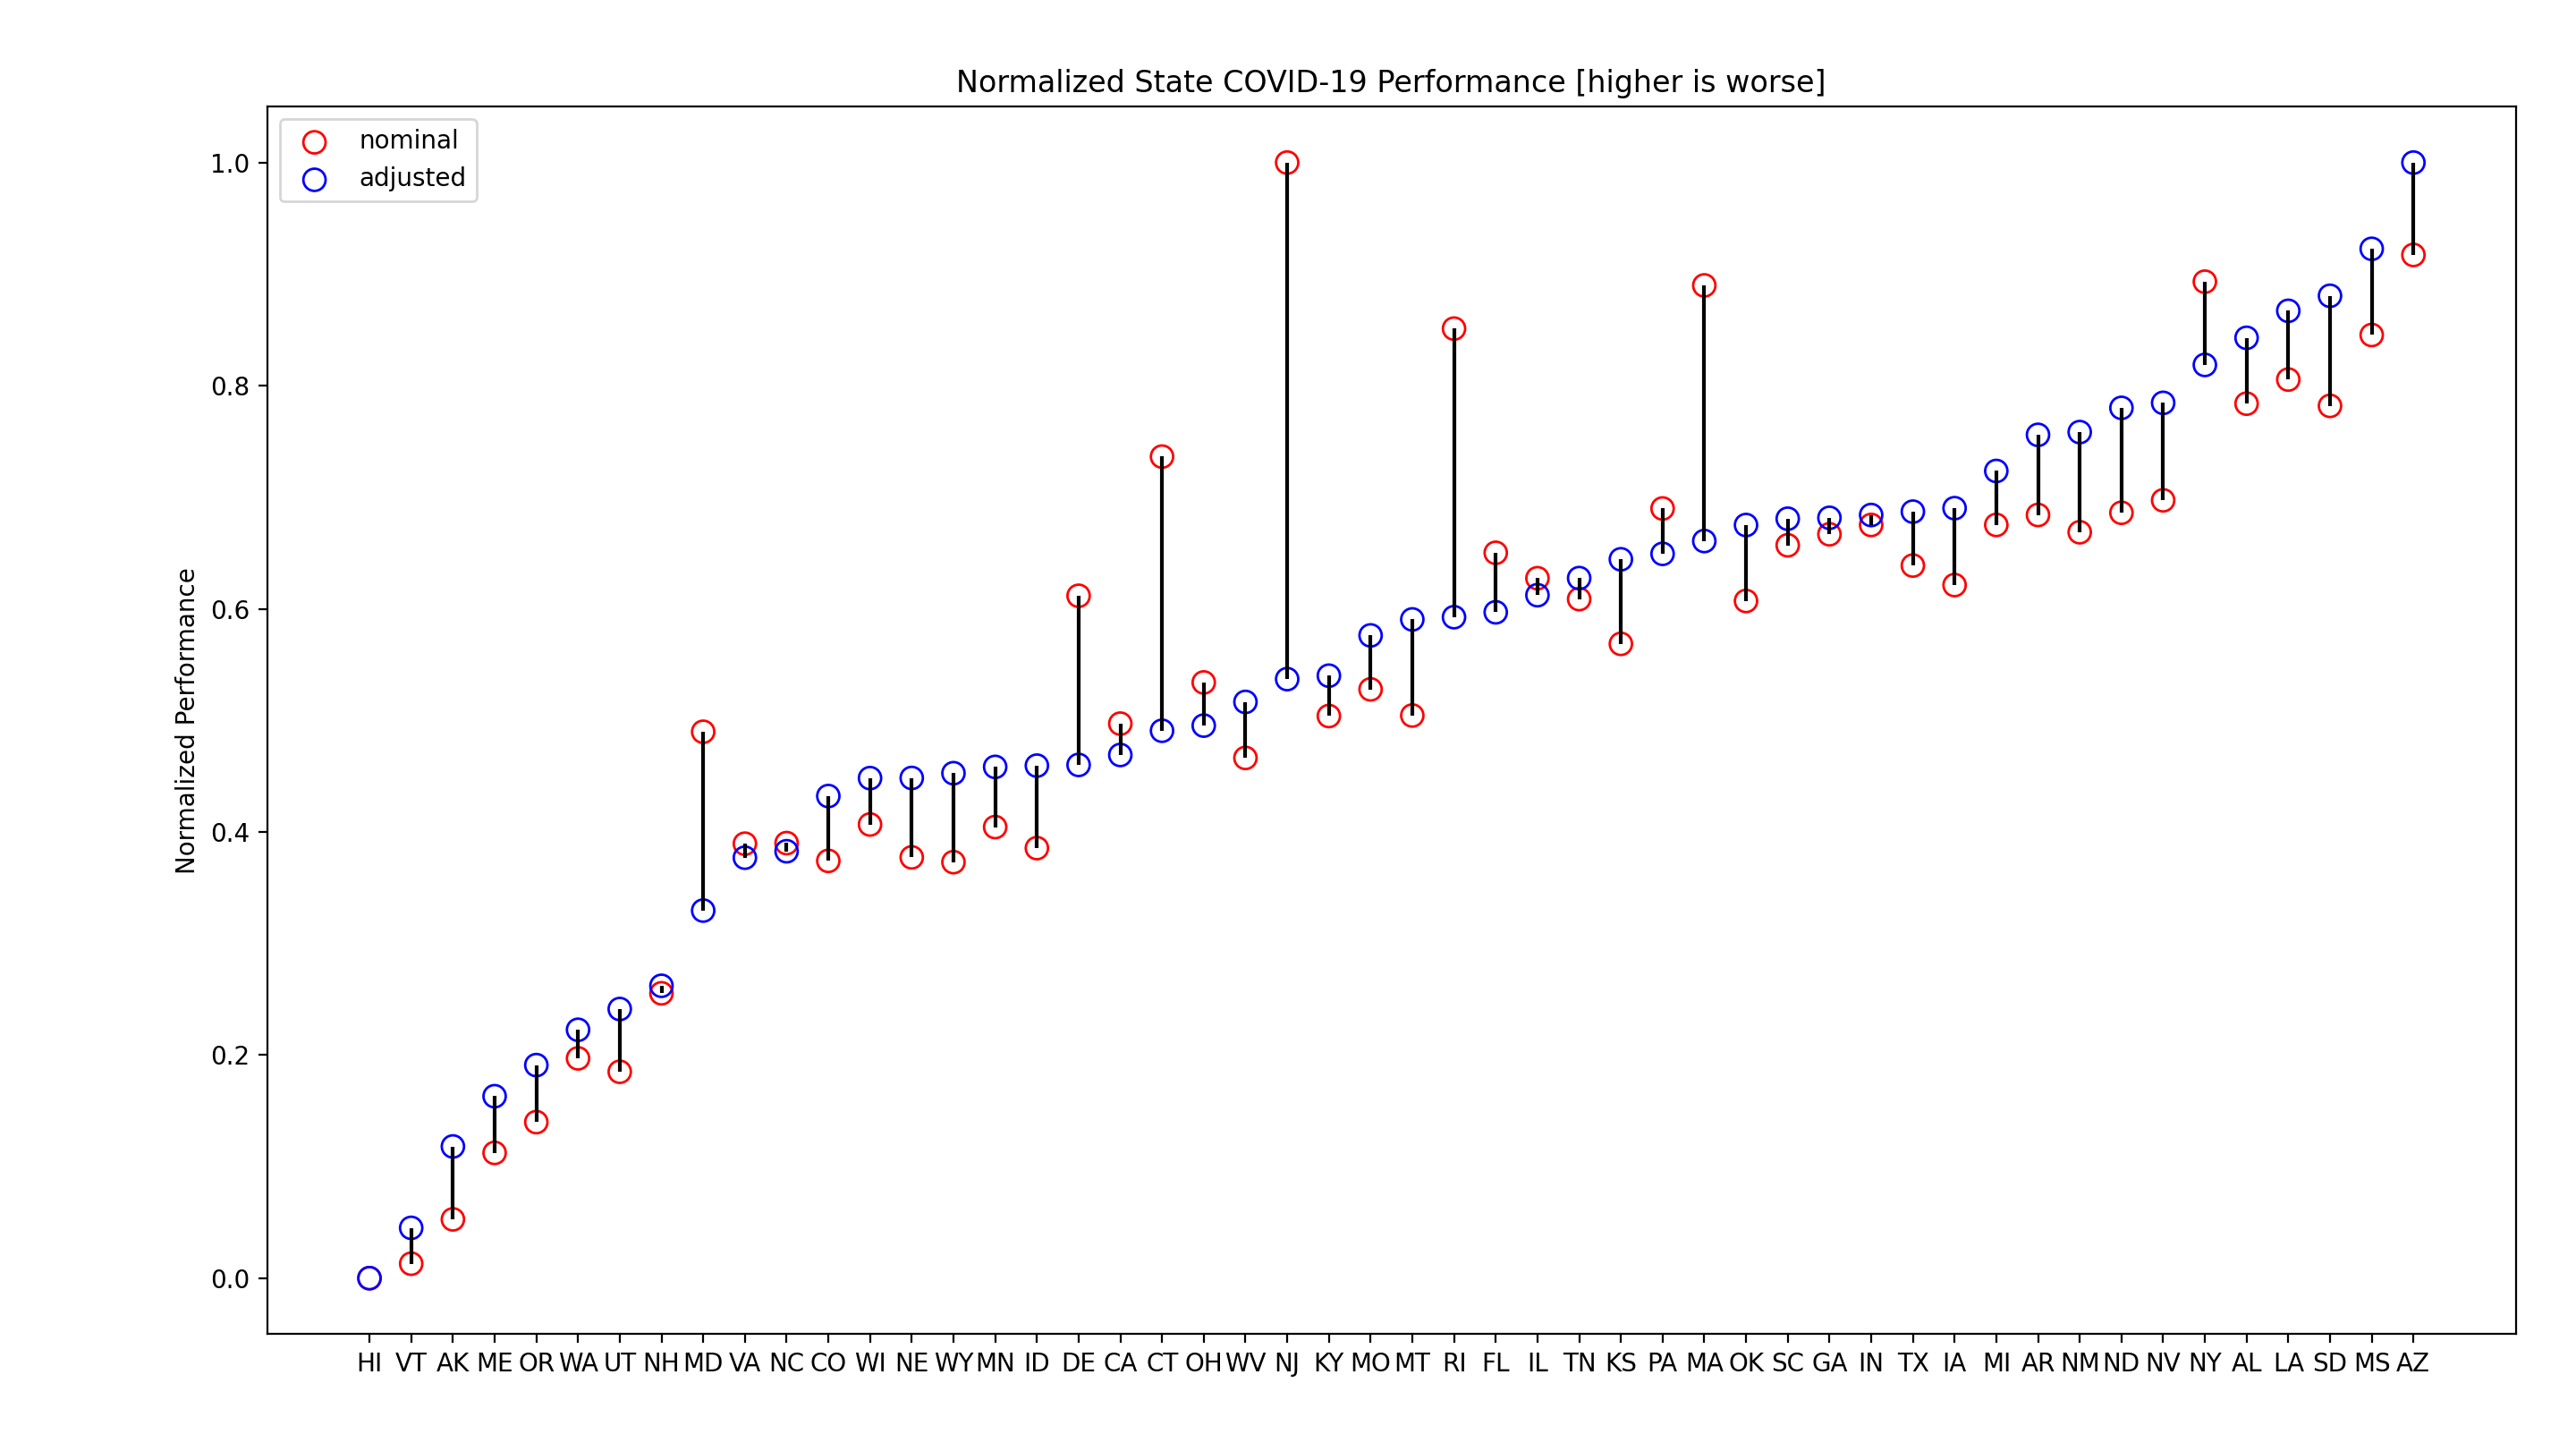
I was curious how relative performance of states might be affected by taking this into account. Specifically, I wanted to look at how states performed relative to one another before and after “subtracting” the effect of population density. Using this methodology, as shown in the plot below, we see that given their density several Mid-Atlantic and New England states have more reasonable COVID-19 performance (NJ shows the biggest delta, going from worst to middle of the pack).
I think that to understand which policies are working in different states (i.e. to take advantage of our laboratories) we need better ways to normalize for inherent differences between states. For example, are the policies of Hawaii the reason it has the lowest per-capita COVID-19 death rate or is it the result of being isolated, having weather that allows people to be outside, etc. Normalizing for these external factors allows us to better understand the effect of policy, and quickly coalesce behind ideas that work.
For anyone interested, the script used to generate these plots can be found here.